
Programme and Gantt
The order of work, drawn out, with what happens if one thing slips.
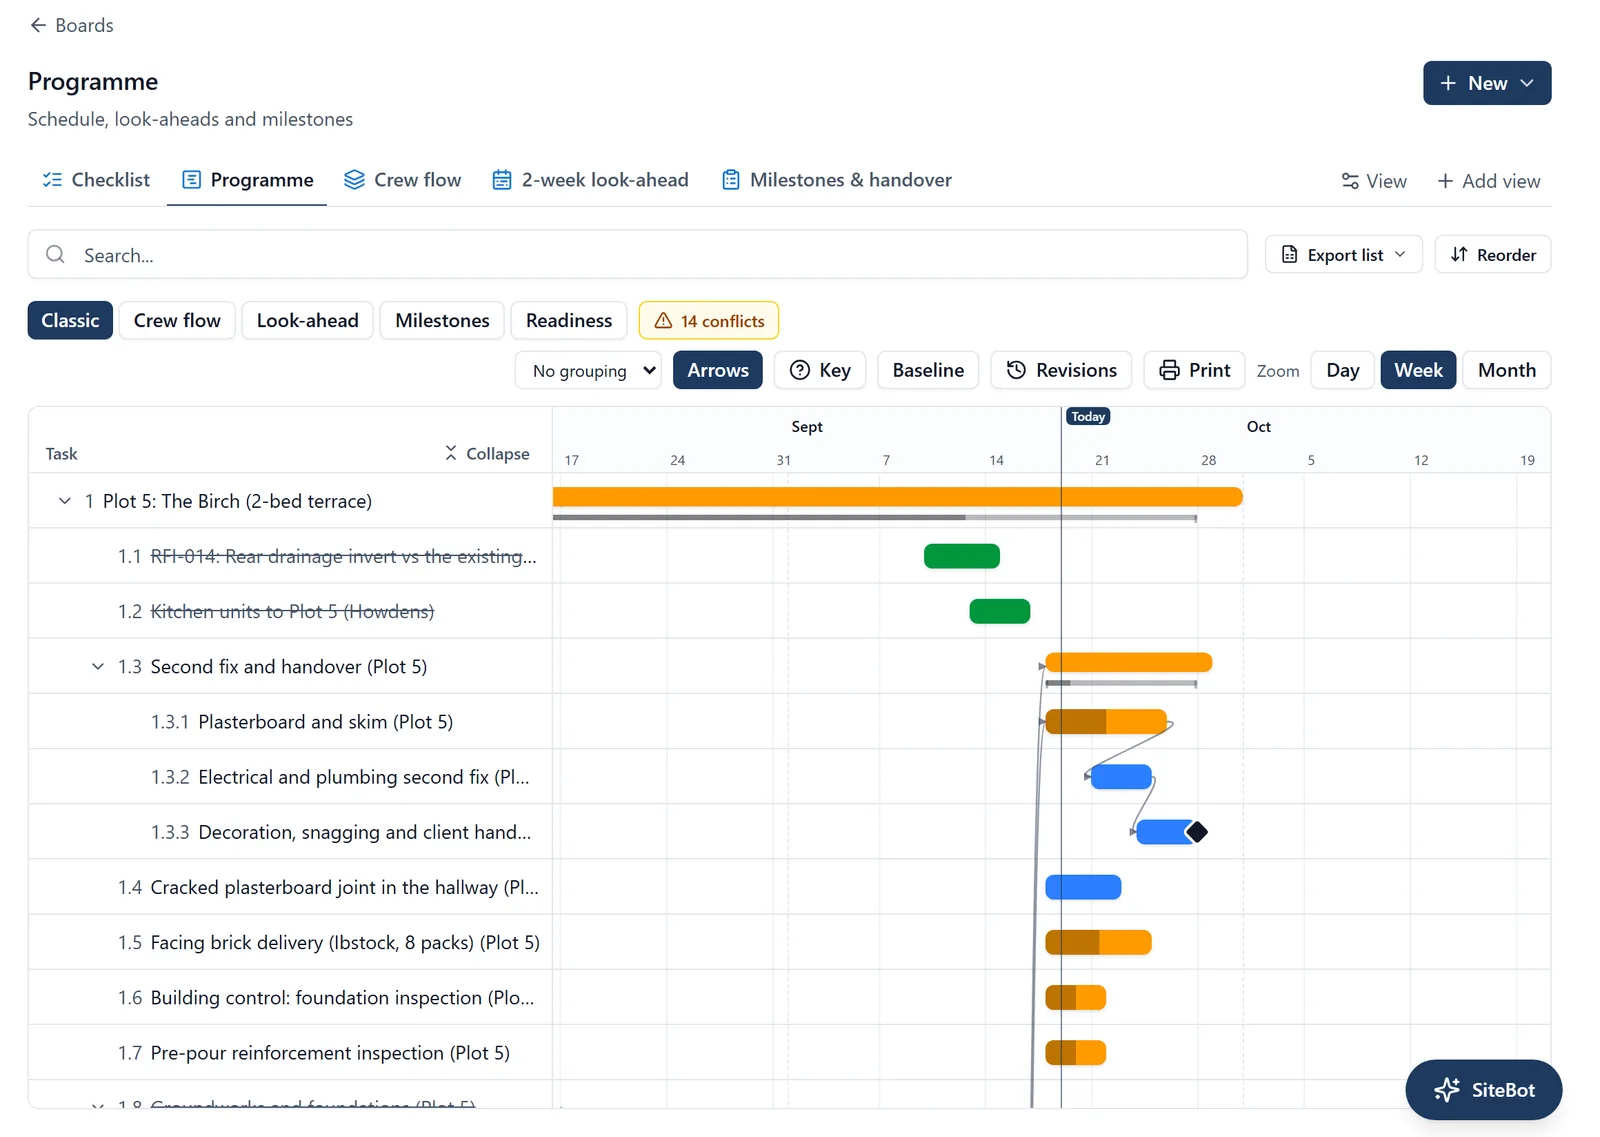
A programme is not a wall chart printed in January. It is the answer to what happens when the steel arrives a week late.
What it does
- A Gantt view of the whole job
- Set what comes after what, with lag between them where the job needs drying time
- See the knock-on when something moves
- Keeps a version history, so you can see what the programme said last month
Why it matters on site
The value is not the picture. It is being able to answer, on the phone, what a week’s slip on one trade does to the trades behind it.
Which plan
This is included in every plan, from £149 a month. Plans differ by how many people they seat, not by what the software does. See pricing.
How to use it
The manual page for this is in the Help Centre, and it is the same guide SiteBot reads inside the app. Read the guide.